
The ideal way to work
Find flexible shifts near you and get paid the same day.
Available on iOS and Android.
Get started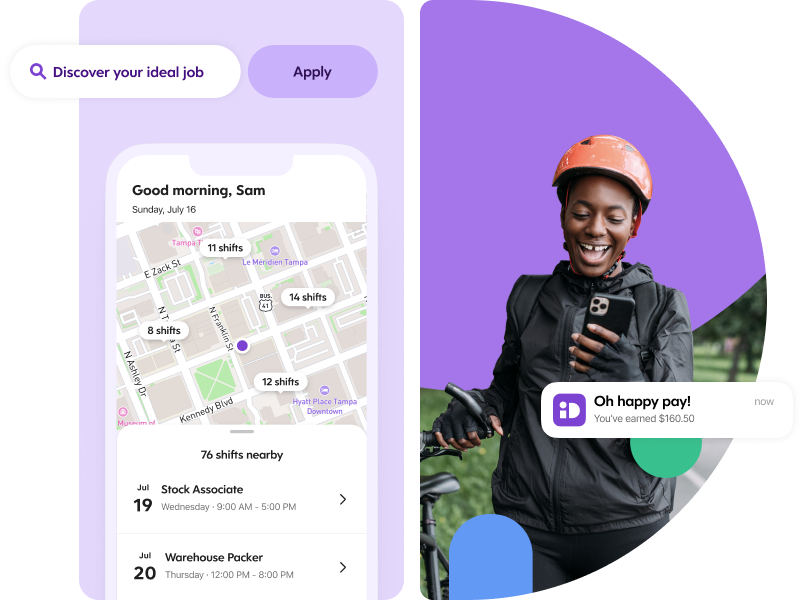
Flexible work, on demand 
Ideal matches people with shifts. It’s that simple.
We make it easy for you to find flexible shift-based work and for organizations to scale their workforce with our on-demand marketplace.
Looking for work?
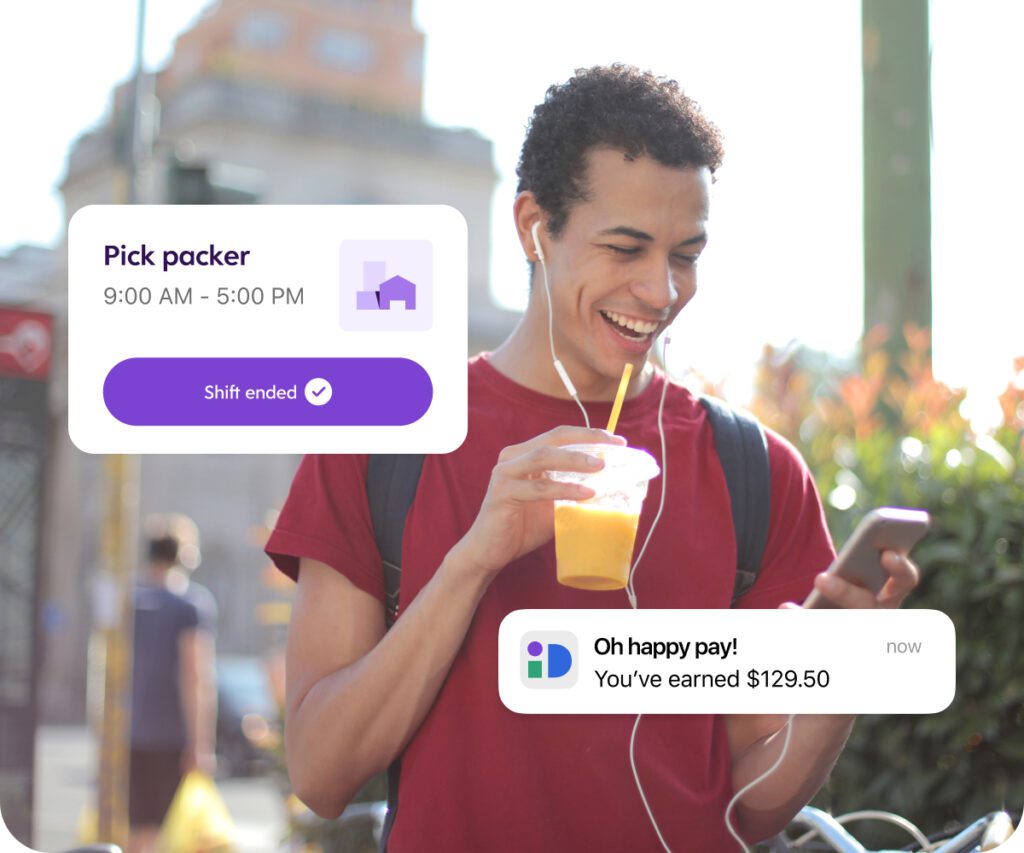
Choose when and where you work
- Create your own schedule
- Join a supportive community that invests in your success
- Apply once, unlock countless opportunities
- Get paid the same day you work with Dayforce Wallet
Looking for people?
Fast and reliable staffing
- Scale your workforce to meet demand
- Fill gaps in your schedule instantly with verified talent
- Tap into new and diversified talent pools
- Reduce overhead; we handle W-2 worker admin
Industries we partner with
-

Customer Service
-
Facilities
-
Healthcare
-
Hospitality & Events
-
Manufacturing & Distribution
-
Retail & Grocery


How it works
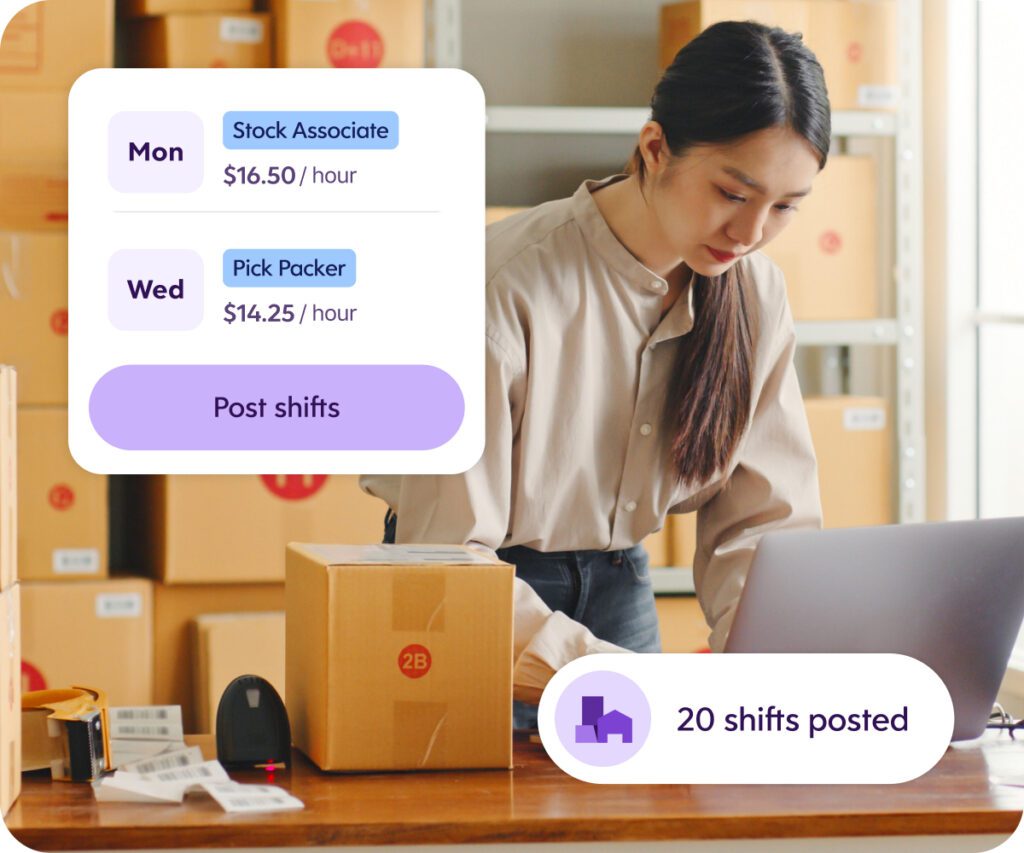
Shifts are posted on ideal
We work with organizations looking to staff flexible talent to meet their changing needs.
Organizations can post a shift to the marketplace and be instantly matched with people nearby.
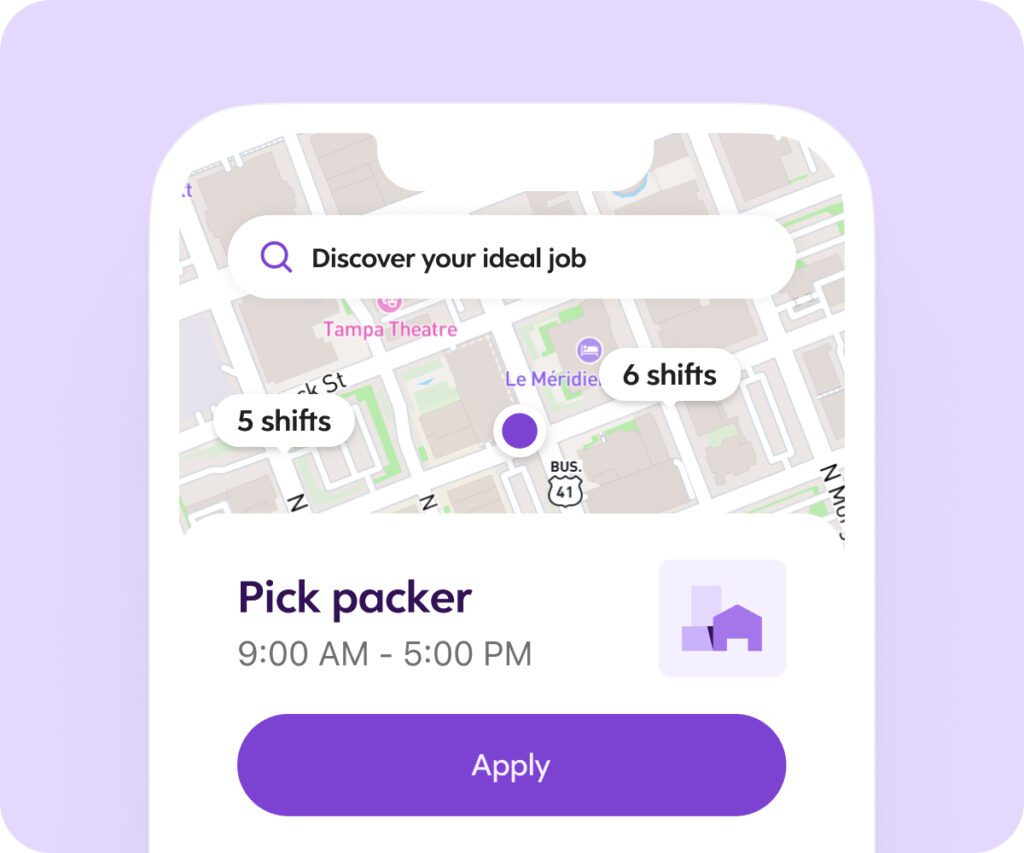
Ideal workers are matched
Ideal workers download the app and complete our W-2 verification process. Once onboarded, they can pick up shifts instantly.
Our algorithms match based on skills, certifications, preferences, and more.
We handle the rest
As the W-2 employer of record, Ideal takes care of the admin and related compliance requirements.
From onboarding to payroll, benefits and taxes, we make it simple and support you every step of the way.